Fall in cm for each metre
Cm below datum
1.
2.
3.
4.
5.
6.
7.
8.
9.
10.
Data Table
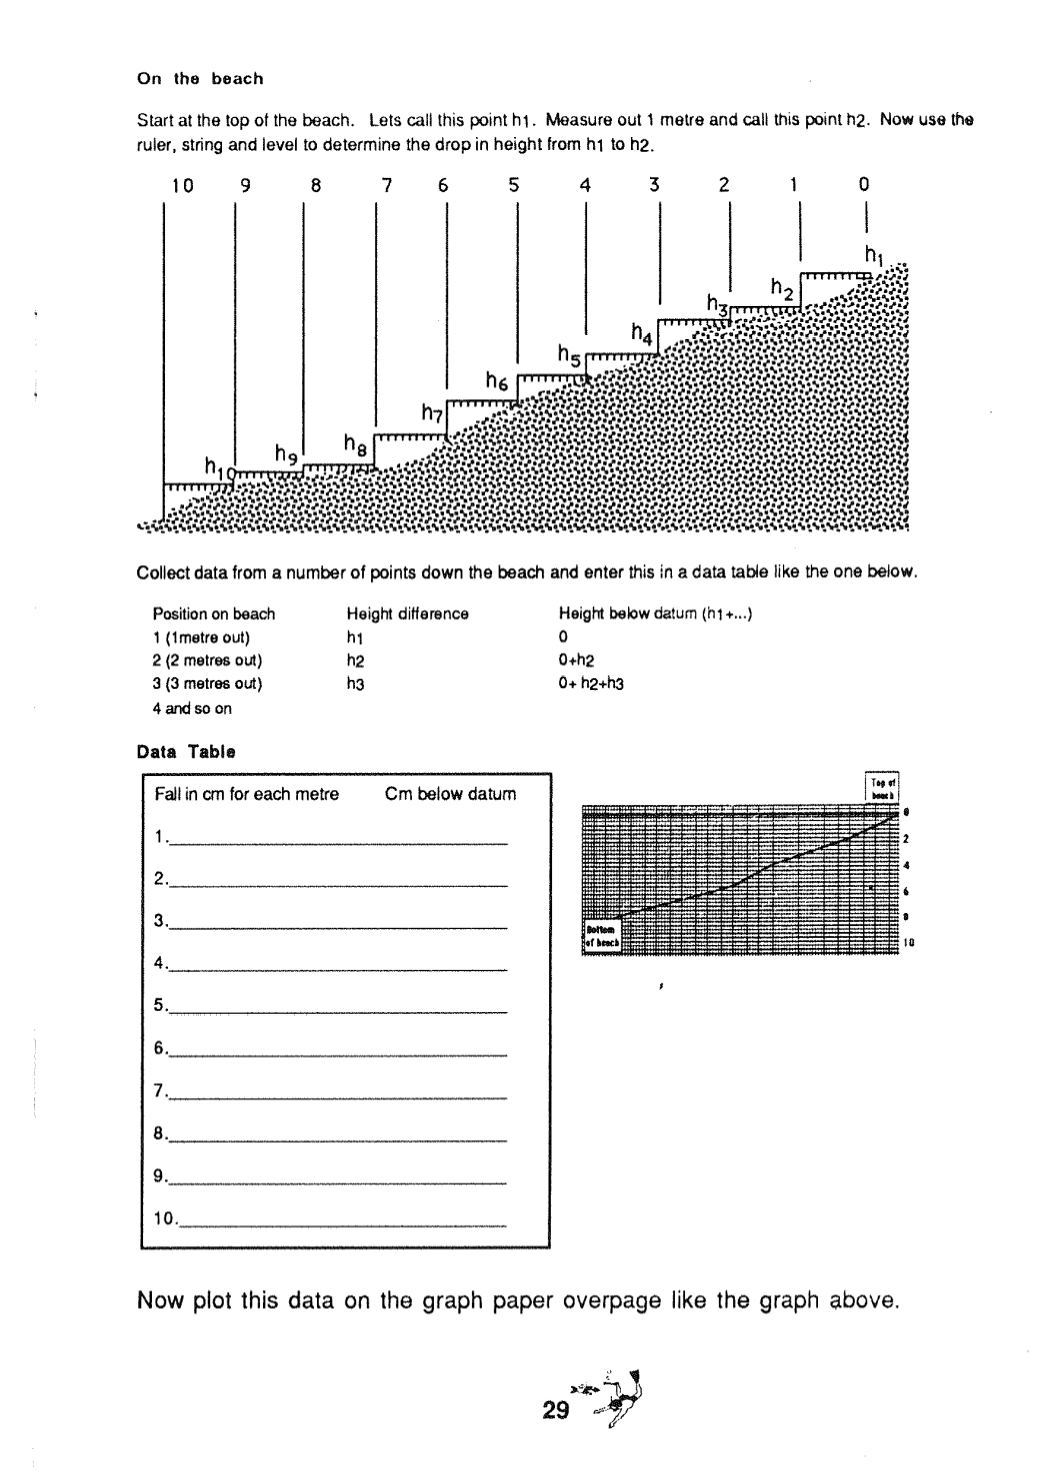
On the beach
Start at the top of the beach. Lets call this point h1. Measure out 1 metre and call this point h2. Now use the
ruler, string and level to determine the drop in height from hi to h2.
10
9
8
7 6
5
4
3
2
0
Collect data from a number of points down the beach and enter this in a data table like the one below.
Position on beach
Height difference
Height below
datum (hl +...)
1 (imetre out)
hi
0
2 (2 metres out)
h2
0+h2
3 (3
metres out)
h3
0+ h2+h3
4 and so on
Now plot this data on the graph paper overpage like the graph above.
29


